Magnitude
Magnitude displays recent currency performance on multiple time frames in an easy to read format to help you identify which currencies performed the strongest and which performed the weakest.
Standard calculations are performed every 5 minutes on 28 currency pairs to calculate the performance of 8 major currencies over the last 24 trading hours. Performance can be configured to measure the average or total of the absolute or relative change in price or pips.
An OANDA v20 account is required for the market data, demo accounts are supported and recommended. Individuals who do not have an OANDA v20 account can register for a free account. To register with OANDA, go to www.oanda.com.
Supported time frames: 15 minute, 1 hour, 4 hour, 24 hour
Supported currencies: EUR, GBP, USD, JPY, CHF, CAD, AUD, NZD
Supported pairs: AUD/CAD, AUD/CHF, AUD/JPY, AUD/NZD, AUD/USD, CAD/CHF, CAD/JPY, CHF/JPY, EUR/AUD, EUR/CAD, EUR/CHF, EUR/GBP, EUR/JPY, EUR/NZD, EUR/USD, GBP/AUD, GBP/CAD, GBP/CHF, GBP/JPY, GBP/NZD, GBP/USD, NZD/CAD, NZD/CHF, NZD/JPY, NZD/USD, USD/CAD, USD/CHF, USD/JPY
Important Note: This application’s ability to function is dependant on the continued availability of market data provided by OANDA.

Similar Tools
Views
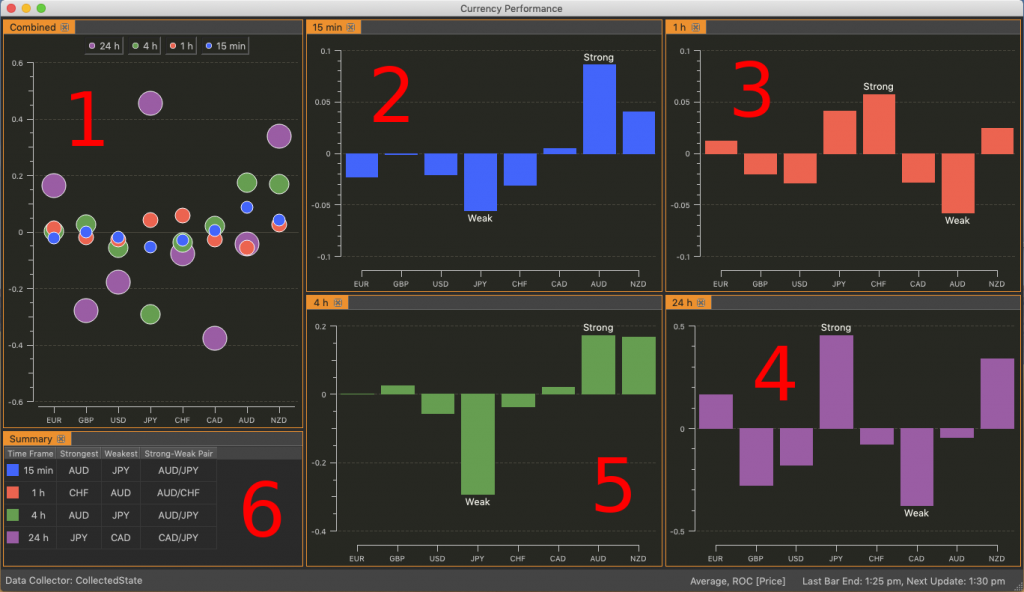
- The Combined Chart plots the results for all time frames.
- The 15 min Chart plots the performance over the last three 5-minute bars.
- The 1 h Chart plots the performance over the last 12 5-minute bars.
- The 4 h Chart plots the performance over the last 48 5-minute bars.
- The 24 h Chart plots the performance over the last 288 5-minute bars.
- The Summary Table lists the strongest and weakest performing currencies along with the matching currency pair for each time frame.
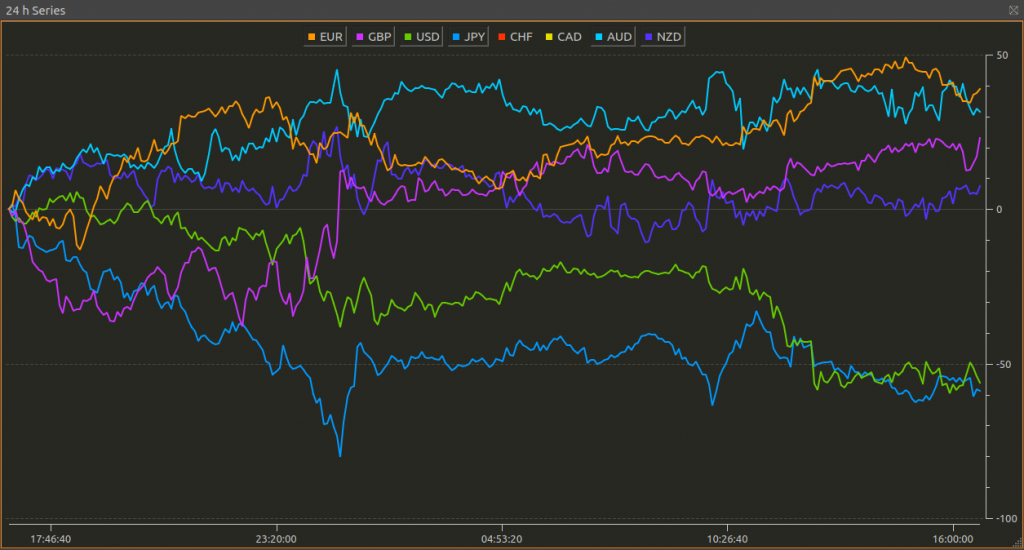
Ranking Pipeline
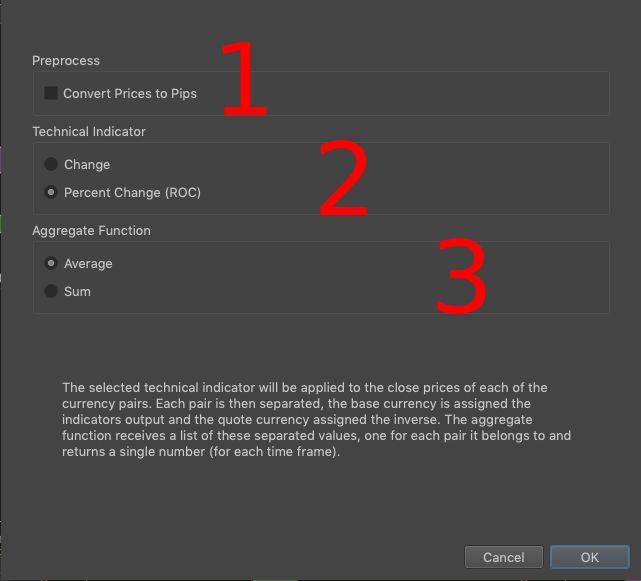
- The Preprocess stage gives you the option of converting the prices into pips
- The Technical Indicator stage applies a ranking function to each currency pair’s data. Two functions are available at the time of writing, Change which represents the absolute change, and Percent Change representing the relative change
- The Aggregate Function stage combines each currencies results from the Technical Indicator stage
OANDA Data Feed
The price data is retrieved from the OANDA servers using your Personal Access Token. If you don’t have an OANDA account you can create a free demo account.
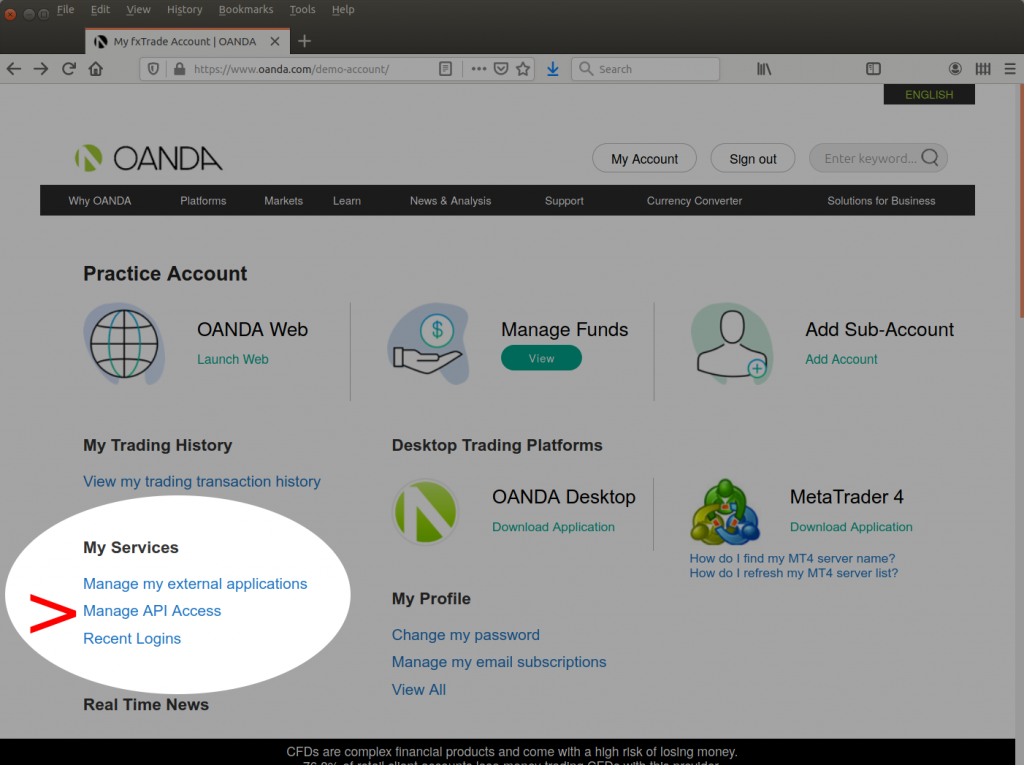
To generate a token for use in Magnitude, select Manage API Access from your OANDA dashboard.
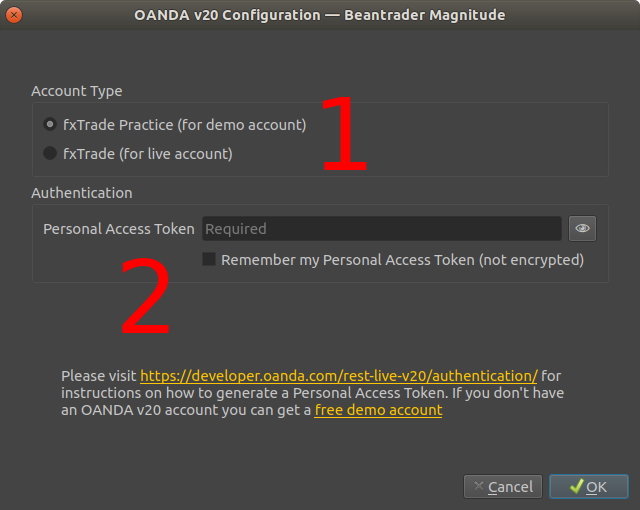
- Select your account type in the first section
- Copy your token from the OANDA dashboard and paste it into the Personal Access Token field. You can optionally have Magnitude save the token for future use. The token is saved on device in an unencrypted plain-text form
When you have connected your OANDA account the app will perform the configured calculation every 5 minutes while the Forex markets are open (5 pm Sun to 5 pm Fri New York time). If the OANDA servers are down for maintenance or otherwise unavailable, the app will have no data to display.
The Menus
File Menu
- Export Results to Excel
- Allows you to export the results, including the intermediate calculations, to an Excel XLSX file
- Export Prices to CSV
- Allows you to export the price data used to a CSV text file
- Connect to OANDA
- Shows the OANDA authorisation options. Use this screen if you want to unsave your token, or to change it
- Reconnect
- Reloads your account and price data
View Menu
Contains menu items to hide or show the various charts and the summary table. You can hide the status bar it too however, it is recommended to keep it on screen as errors and progress indicators are displayed there. It may be important to know when the data was last updated.
TIP: Click on the calculation configuration label on the status bar to show the preferences window
Layout Menu
The layout menu will be populated by custom layouts you can save and switch to instantly. The Reset to Default Layout option resets the active layout, leaving your other layouts unchanged.
You can combine all the views into a tabbed interface, hide unneeded time frames, and resize the window how you like.

